
The Story Behind This Indicator
Year One: The Loss Phase
2017 – 2018
My first year trading crypto was a masterclass in what not to do. I lost thousands — not because I lacked intelligence, but because I chased complexity. MACD. Stochastic. Fibonacci extensions. Ichimoku clouds. I stacked indicator on top of indicator, convinced that more information would give me an edge.
It didn't. Every new indicator added a new conflict. Buy signal here, sell signal there. I was paralyzed at the moment I needed to act, and impulsive when I should have waited. The screen was a wall of noise, and I mistook busyness for skill.
“The market doesn't reward complexity. It rewards discipline.”
The turning point came after a particularly brutal week. I sat down, closed every chart, and asked a single question: What actually tells me what I need to know?
The answer was two things: RSI for momentum and direction, and a Baseline moving average for trend position and stop-loss anchoring. I stripped everything else out. Then I started testing.
v1 – v19
Versions Tested
6 Years
Years of Development
Swing Only
Trading Style
Version 15 is the result of years of testing, losing, learning, and rebuilding. Every parameter has a reason. Every rule was born from a mistake that cost real money.
Why 3 Lines — RSI + EMA9 + WMA45
“Add more indicators and you don't get more clarity. You get more noise. Three lines is enough.”
RSI
CORE- →Momentum: Is the move strong enough? ≥75 = strong bull, ≤25 = strong bear
- →Stage: Where are we in the sequence? Momentum → Pullback → Bounce
- →Reversal: When RSI/EMA/WMA order fully reverses — exit
EMA9
FAST- →Short-term: Tracks fast momentum changes in RSI space
- →Pullback zone: RSI dipping below EMA9 = pullback confirmed
- →Bounce signal: RSI crossing back above EMA9 = Stage 3 trigger
WMA45
SLOW- →Trend filter: Slow anchor — confirms the bigger trend direction
- →Pullback gate: RSI below BOTH EMA9 + WMA45 = valid pullback zone
- →JMA ref: Works alongside JMA Baseline for trend confirmation
Three lines. Each one serves a distinct purpose. RSI measures momentum. EMA9 tracks the pullback. WMA45 confirms the bigger trend. When all three align in sequence — that's when I enter. Not before.
The Rule That Saved My Account
The 1% Rule — No Exceptions
Risk exactly 1% of your account on each trade. Not 1.2%. Not “just this once” 3%. One percent. Every single trade. Forever.
“Before you can make money, you have to keep the money you already have.”
— Warren Buffett
Lot Size Calculation Example
$10,000
Account Size
Your total capital
$100
1% Risk
Max loss per trade
$1,000
SL Distance
Entry to stop-loss
The Math That Makes This Work
With a 1:10 Risk/Reward ratio, you need to win only once every 10 trades to break even. That means you can lose 9 in a row and still not lose money.
“Stop-loss is not money lost. It's business cost.”
Entry Logic — 3-Stage Sequence
“Buy the dip, not the peak. Confirm trend. Wait for pullback. Enter on bounce.”
Every valid entry in v19 has three stages — in order. Skip one, skip the trade. This is the core philosophy: confirm momentum, wait for the dip, enter on the bounce.
LONG — 3 Stages in Order
Momentum Confirmed
RSI closes ≥ 75Strong bullish momentum. The move is real, not noise. Don't enter here — this is the signal, not the entry.
Pullback Validated
RSI dips below EMA9 + WMA45Price is pulling back after the momentum spike. Both the fast (EMA9) and slow (WMA45) lines must be above RSI. This is the "buy the dip" zone.
Entry Triggered
RSI crosses back above EMA9/WMA45 → LONGThe bounce is confirmed. RSI reclaims both lines. This is the entry candle. Stop-loss below the Stage 2 low. Target 1:3 minimum.
SHORT — Mirror Logic
RSI ≤ 25
Strong bearish momentum confirmed
RSI bounces above EMA9 + WMA45
Dead-cat bounce / pullback above both lines
RSI crosses back below → SHORT
Entry triggered. SL above Stage 2 high
Exit Rule — Simple
Exit when the RSI / EMA9 / WMA45 order fully reverses. For a long: RSI crosses below EMA9, then WMA45 follows — that\'s the exit signal. No guessing, no targets. The lines tell you when it\'s over.
The Train That Taught Me Patience
“No consensus, no trade. Most of trading is waiting.”
Think of price action like a train. Multiple timeframes are the cars. When all cars move in the same direction — the train is running. Enter and ride.
All Cars Aligned
All TFs agree → enter with full size, high conviction trade
Cars Out of Phase
Mixed signals → wait. Adding fuel (position) to a confused train is dangerous
Train Reversing
Higher TFs flip → the train slows before turning. Exit before the reversal completes
RSI+BL Dashboard — 18 Timeframes
Elliott Waves — The Simple Version
Forget the classic wave counting that requires a PhD. My approach: count RSI momentum cycles. Each cycle corresponds to a wave. That's it. Here's what to do at each wave:
Skip It — Always
First wave is the signal, not the trade. No entry here.
Prepare — Small Entry
Price pulls back. RSI makes a higher low. Load 50% position with tight SL.
The Money Wave — Full Size
Strongest momentum. All TFs aligned. Enter with conviction, target 1:10+.
Close Half Position
RSI shows momentum slowing. Take 50% profit, move SL to break-even.
Exit Remaining
Divergence appears on RSI. This is the exit — don't get greedy.
Stay Out
Corrective phase. Confusing, unpredictable. Wait for the new W1.
“Skip the first wave. Always. The first wave is the signal — the second wave is the profit.”
The Sentence That Changed Everything
“Price movement must create smoothness in the moving average.”
The sentence I return to every single day
This one sentence unlocked three things I couldn't figure out for years:
Timing
If price is moving smoothly, the MA is trending cleanly. That's when to hold. When price gets choppy, the MA flattens — that's when to exit or tighten SL.
Trend Validity
A valid trend creates a smooth, consistently-sloped MA. An invalid move (noise, spike, manipulation) creates a jagged MA. Smooth MA = real trend. Jagged MA = stay out.
Price Target Estimation
Because the MA can never suddenly reverse direction, you can estimate roughly where the crossover will happen. This gives you a price target without any guessing.
Lessons That Cost Me Real Money
“The market doesn't care about your bills, your ego, or your timeline.”
Never trade against the higher timeframe trend
Lost 2 weeks of gains fighting the D1 trend on H1 setups
Never flip positions without exiting first
Emotional reversal trade wiped out a week of profits in one candle
Divergence ≠ immediate reversal
Shorted RSI divergence on W3 — stopped out 3 times before the reversal came
Below M15 is management only — not entry
Took M5 entries when D1 wasn't aligned. Worked twice, failed ten times.
When in doubt, stay out
Forced trades out of boredom. Boredom cost me more than bad setups.
If you're anxious, close half the position
Anxiety is data. It means the setup wasn't clean enough for full size.
My Daily Routine
“A good trading system gives you more time, not less.”
Morning Check
~15 min
- Check D1 + H4 RSI baseline status
- Review open positions — SL still valid?
- Scan dashboard for TF alignment changes
- Set price alerts for potential setups
Evening Review
~20 min
- End-of-day D1 candle close confirmation
- Update trade journal — what happened, why?
- Check weekly structure if Monday/Friday
- Set next day's alerts and close chart
Total screen time: ~35 minutes per day. I am a swing trader. I don't stare at screens. I don't scalp. I don't day trade. I set up the context in the morning, review in the evening, and let the system work in between. This is the only sustainable way to trade long-term.
Built for FTMO
RSI+BL Alert v19 was designed with FTMO rules in mind from the start. The 1% rule maps perfectly to prop firm risk parameters. Here's how the numbers work for both common FTMO sizes:
$10,000 Account
10% target = $1,000
$25,000 Account
10% target = $2,500
The math is clear: with a 1:10 system, you only need one clean W3 trade to pass the FTMO challenge. The system is designed to protect capital through 9 losses and win on the 10th. That's not luck. That's calculated edge.
v19 Settings — 3 Lines Explained
These are the exact parameters used in RSI+BL Alert v19 on TradingView. All settings are pre-configured in the published script — just add it to your chart.
| Parameter | Value | Role |
|---|---|---|
| RSI LONG threshold | ≥ 75 | Stage 1 LONG trigger — confirms strong bullish momentum |
| RSI SHORT threshold | ≤ 25 | Stage 1 SHORT trigger — confirms strong bearish momentum |
| Fast MA (EMA) | EMA 9 | Tracks fast RSI pullback. Stage 2 requires RSI < EMA9 |
| Slow MA (WMA) | WMA 45 | Trend anchor. Stage 2 requires RSI < WMA45 too |
| Baseline | JMA | Jurik MA — smooth trend reference line on price chart |
| Best Timeframe | 15m – 4h | Optimized for swing and intraday on BTC futures |
| Risk per Trade | 1.0% | Fixed. Non-negotiable. SL = Stage 2 swing low/high |
| Target RR | 1:3 min | Minimum. Full reversal exit replaces fixed TP |
v19 Built-in Features
JMA Baseline
Jurik Moving Average as smooth trend reference on price chart
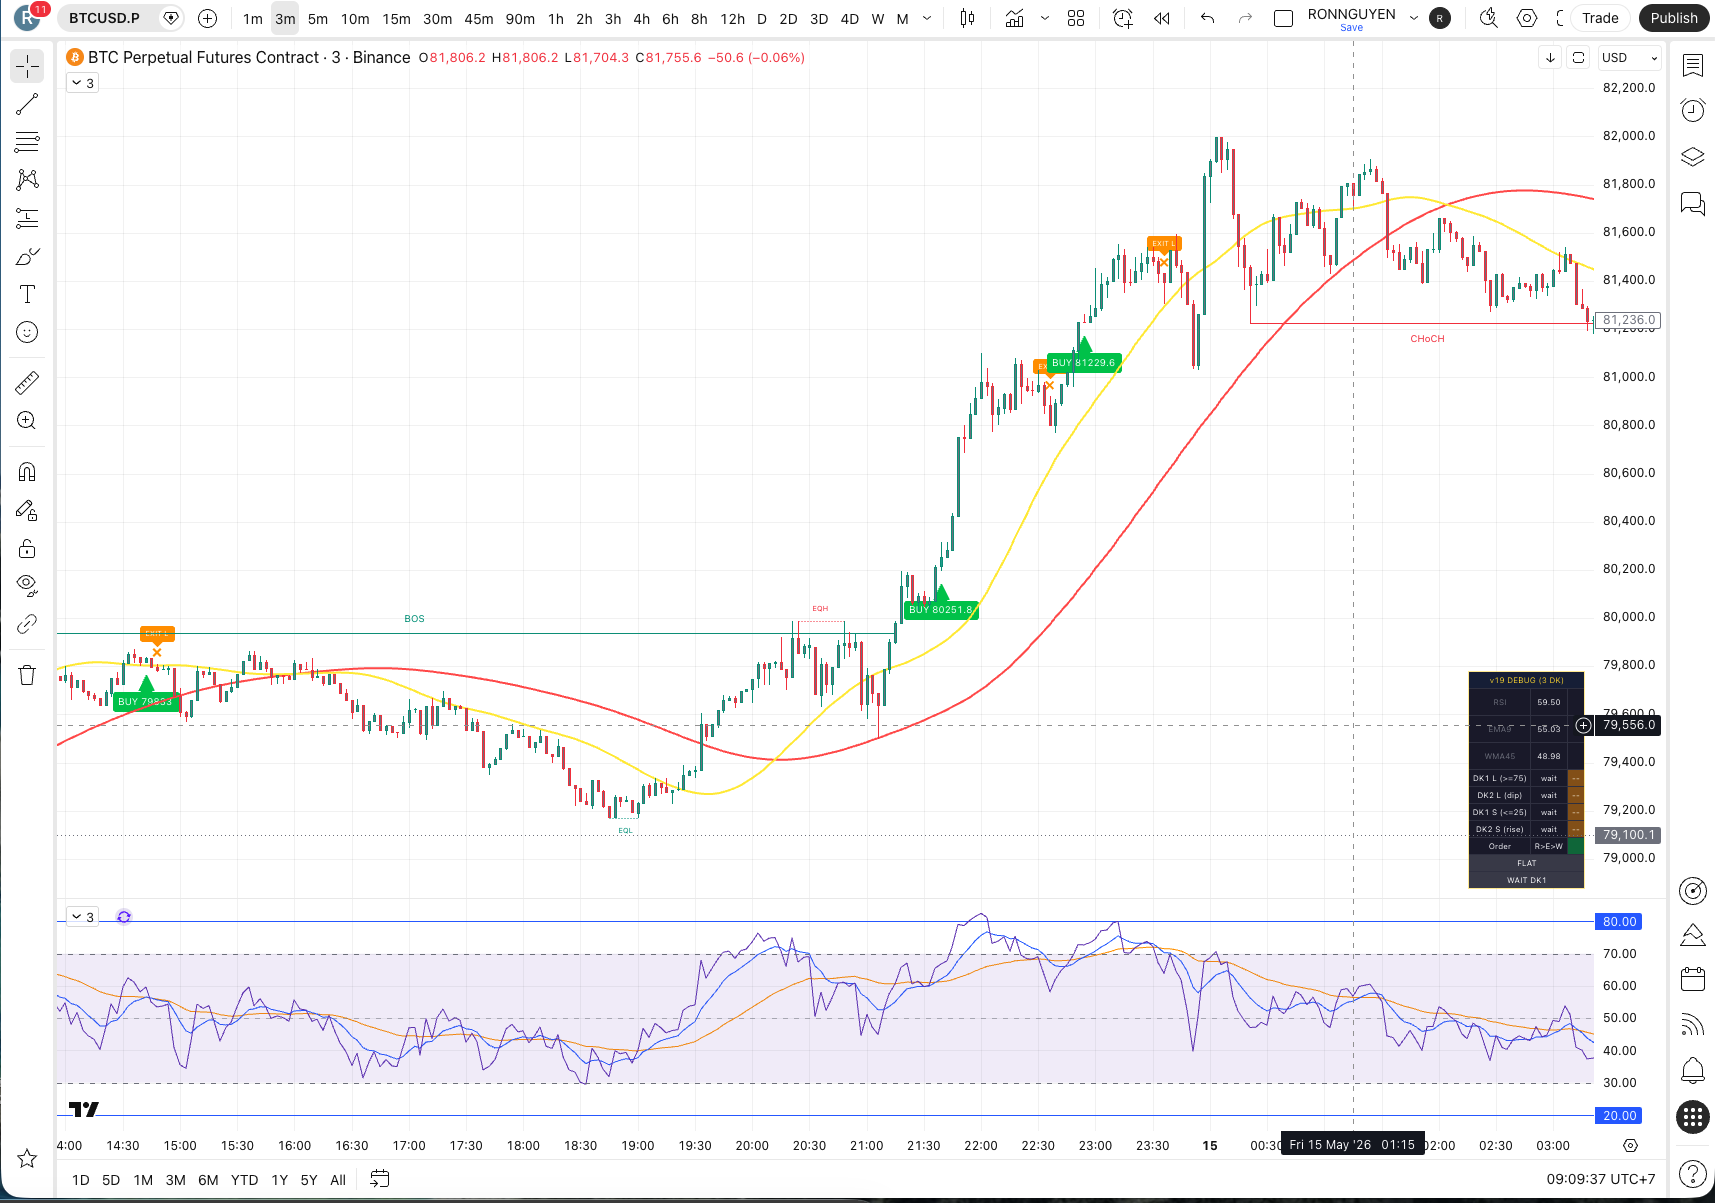
Live Debug Dashboard
Real-time Stage 1/2/3 status panel directly on the chart
BUY / SELL / EXIT Labels
Visual entry and exit labels appear on chart candles
Built-in Alerts
Pre-configured TradingView alerts for each stage trigger
Best For
- Swing traders (H4 – D1)
- Intraday traders (15m – 1h)
- Quality entries over quantity
- Bitcoin Futures traders
Not For
- Scalpers (below 5m)
- Sideways / ranging markets
- Altcoin traders (untested)
- Automated / bot trading
Get RSI+BL Alert v19 — Free on TradingView
All settings pre-configured. JMA Baseline + Debug Dashboard + Alerts included.
Questions I Always Get
These are the 5 questions I get every single time I post a chart. Answered honestly, no marketing.
“The goal isn't to be right. The goal is to lose small and win big.”
— Ron OnCrypto
Put the System to Work
See Real Results — 47 Live Trades, 15 Months
Full trade log · Equity curve · Monthly breakdown · Notable deep-dives
Risk Disclosure
Trading involves substantial risk of loss. RSI+BL Alert v19 is an educational tool and not financial advice. Past results are not indicative of future performance. Never risk money you cannot afford to lose. See our affiliate disclosure.